 KwickScan
COST
Costco · found Aug 2026
+8%since the breakout
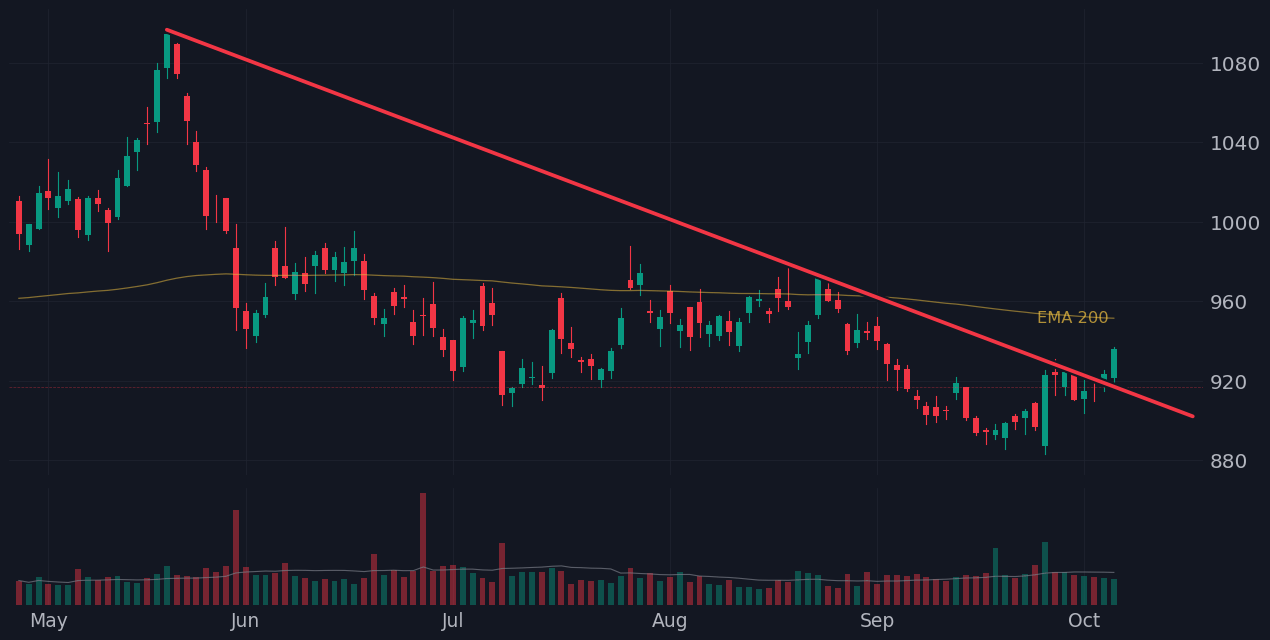
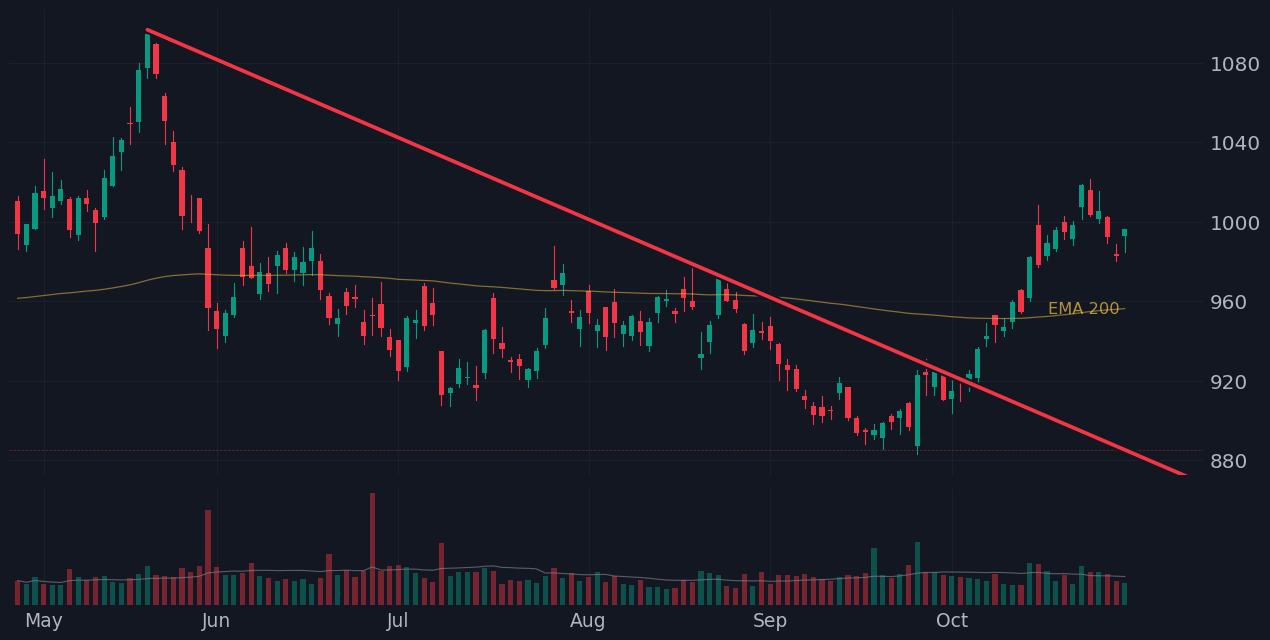
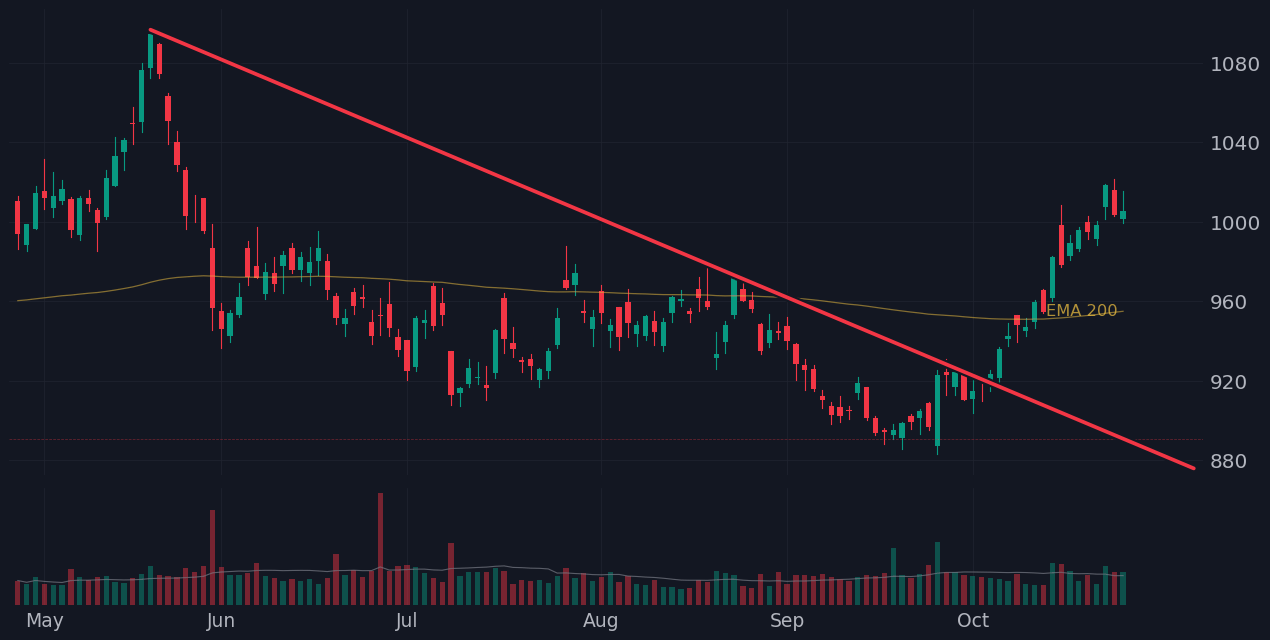
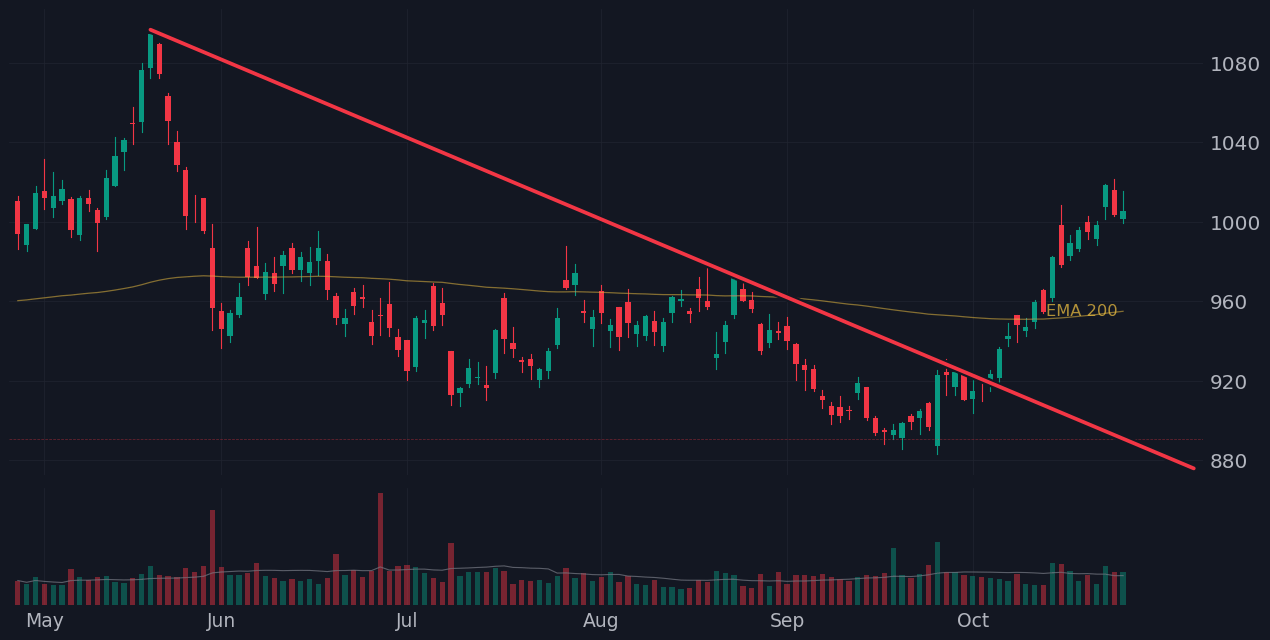
Daily chart. Broke out Oct 5, 2026 at $923.52 and confirmed Oct 6, 2026. Closed at $996.08 on Oct 29, 2026.
Opening in November, with limited seats. Join the waitlist to get in first.
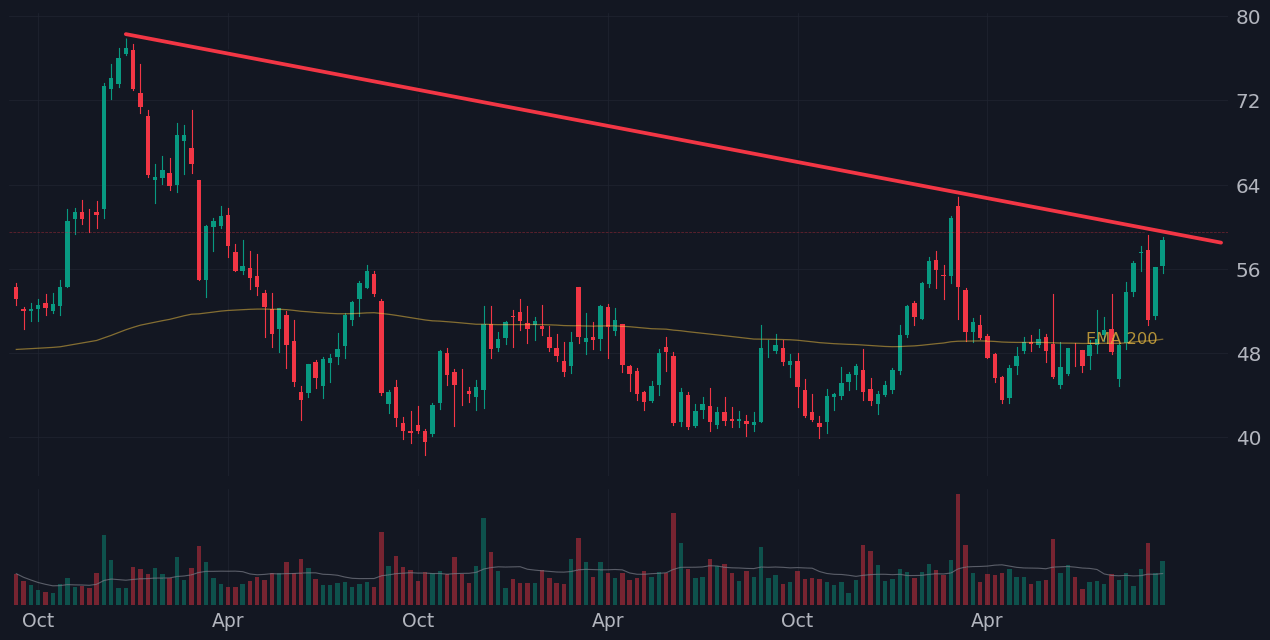
4.2% under its resistance line. A daily close above $937.56 would be a breakout.
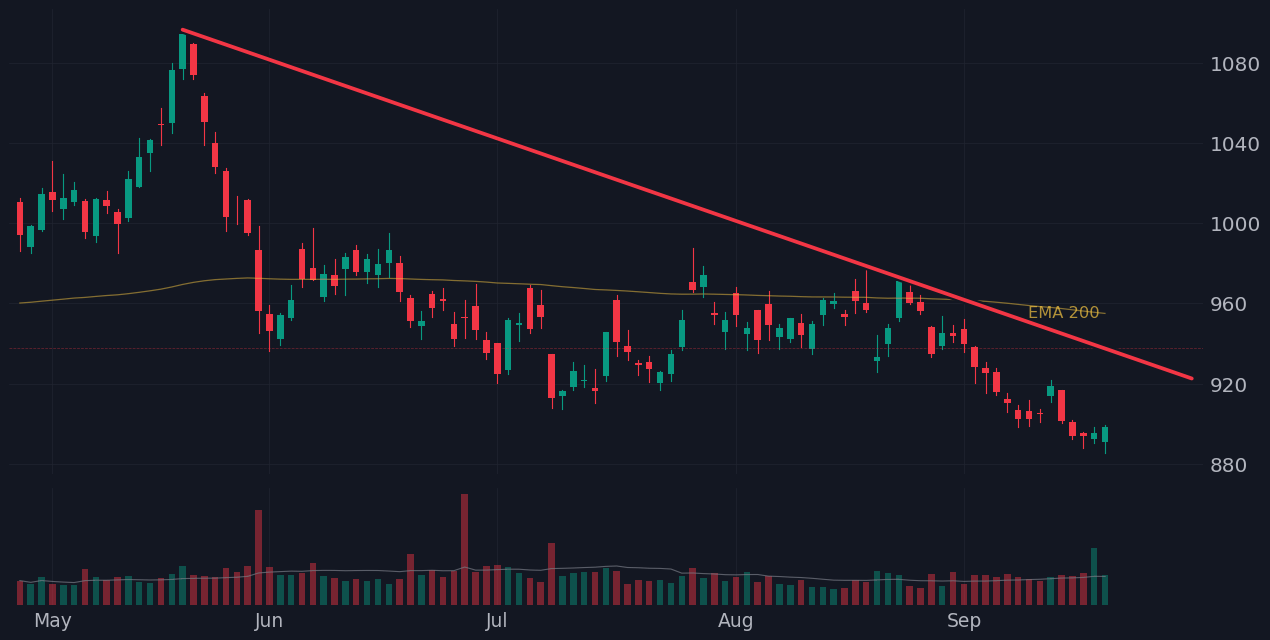
COST on the daily chart: each step as the scanner showed it on that date.
Every tool works in a few plain steps. Pick one to see how.
Every stock moves through these steps on its own, checked every day with the same rules for every stock.
It's close to a price it couldn't get past before. Now it's on the watch list.
WatchIt closed above that price. Checked every day to see if the move holds.
Broke outThe move kept going. It stays on your list until it has run well past that price.
ConfirmedIf it turns down instead, before or after breaking out, it comes off your list that day, with the reason.
Or it comes offFor any stock, whether or not it is on the list.
Any stock in the market, from the search box.
Is the trend up? Is the long-term picture healthy? Where is the price that matters?
Act on it, or add it to your Focus list to keep an eye on it.
Company reports can move a stock sharply either way. Know before they land.
This week, next week, or last week to see who already reported.
Each day, before the market opens or after it closes.
Your setups and Focus list stocks are marked and listed first. Click one to check it.
Your own short list of stocks to keep an eye on.
On any stock card, or add a ticker by name.
Your list is always on screen, with each stock's step and price.
Tick "Show only these stocks" to see just your list. Earnings coming up are flagged.
Real setups the scanner found and confirmed, with the chart the day it confirmed and the chart today. Not every setup works.
Daily chart. Broke out Oct 5, 2026 at $923.52 and confirmed Oct 6, 2026. Closed at $996.08 on Oct 29, 2026.
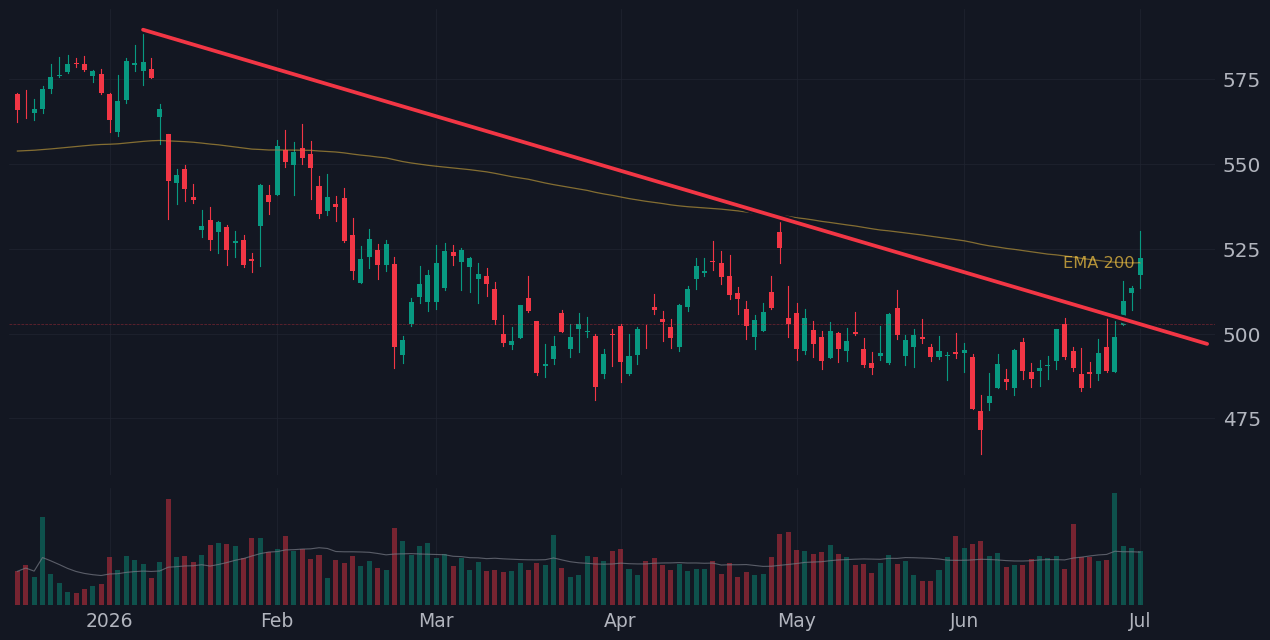
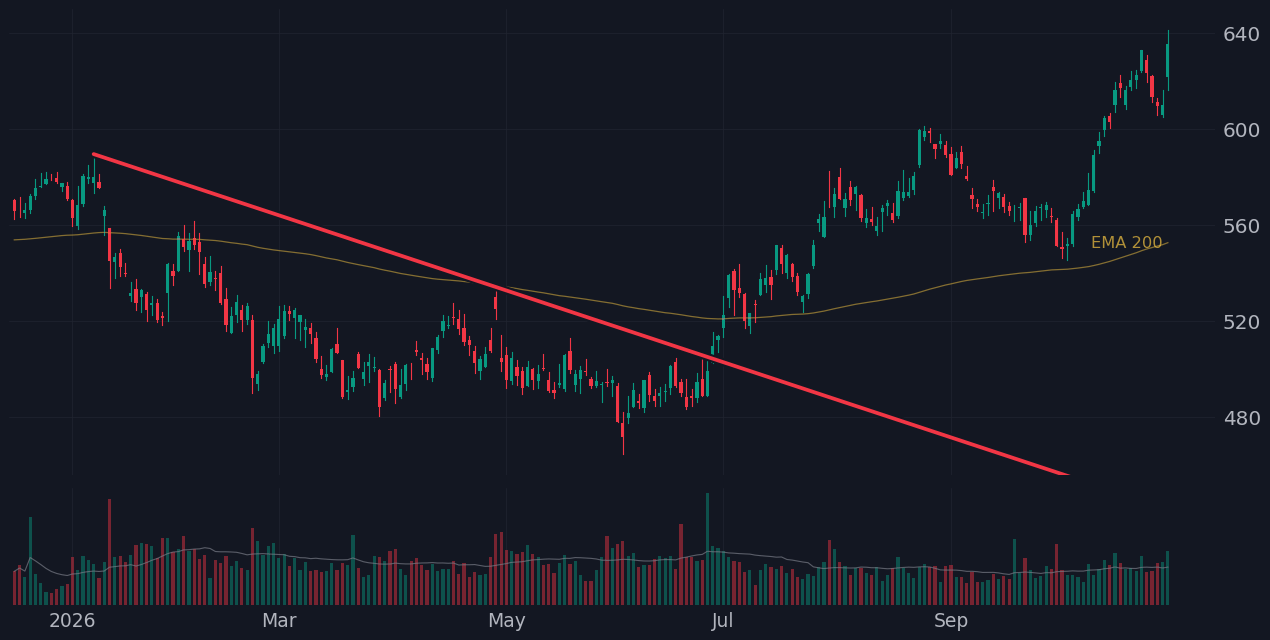
Daily chart. Broke out Jun 29, 2026 at $509.64 and confirmed Jul 1, 2026. Closed at $635.70 on Oct 29, 2026.
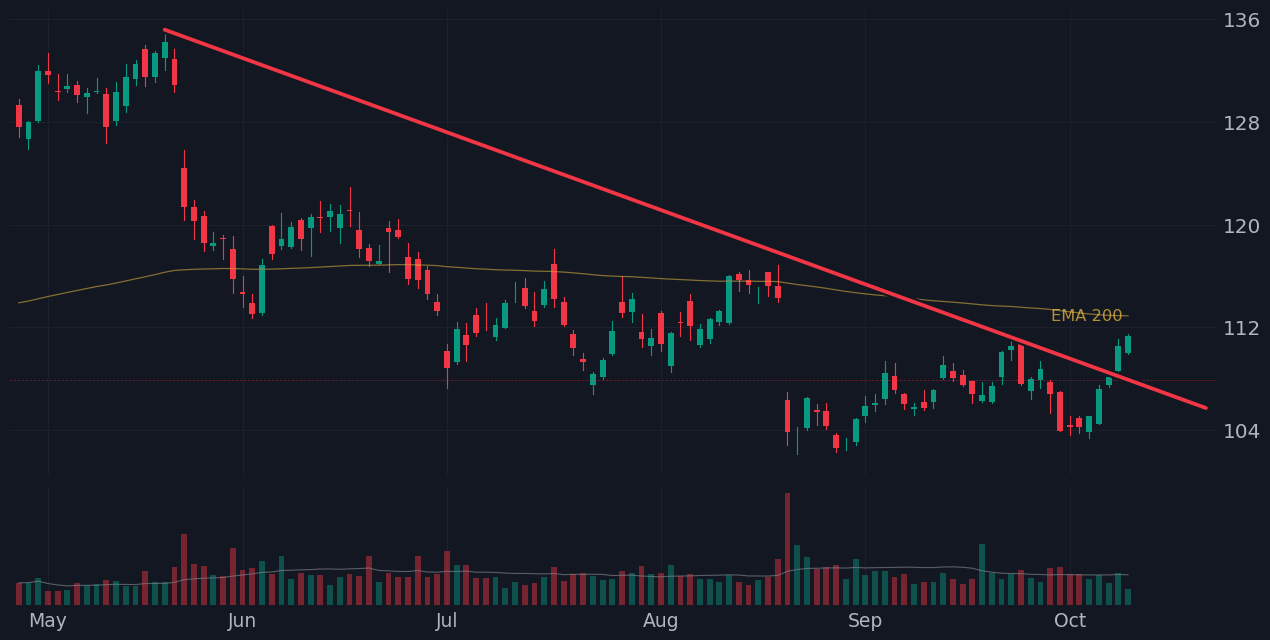
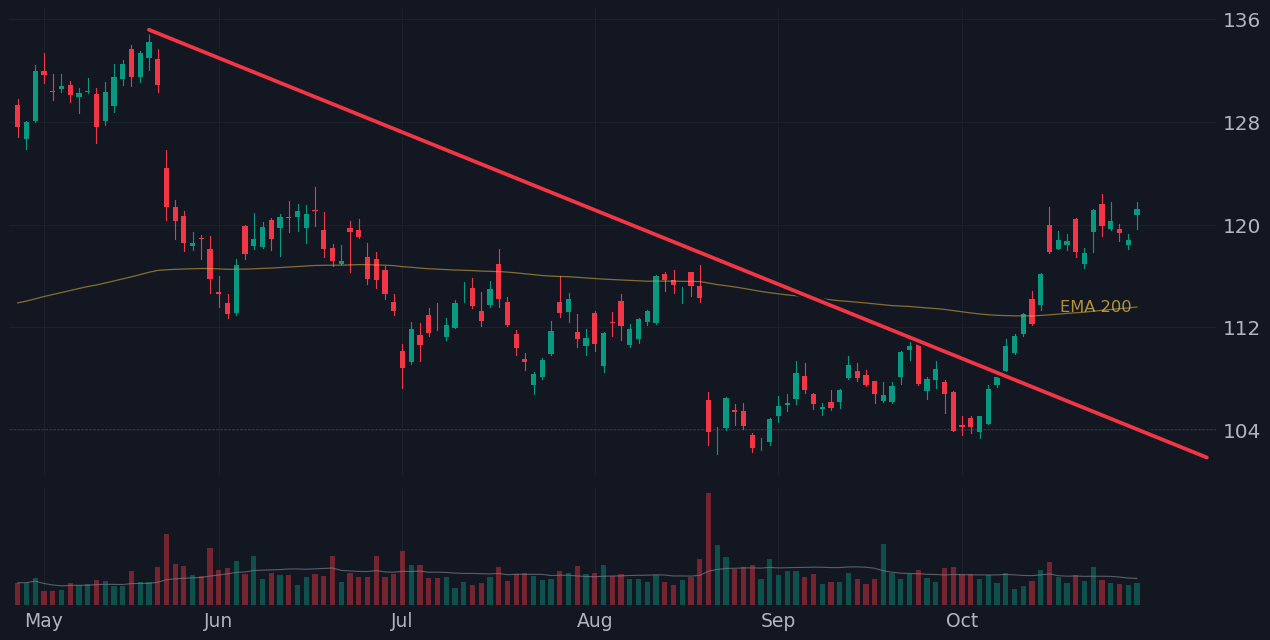
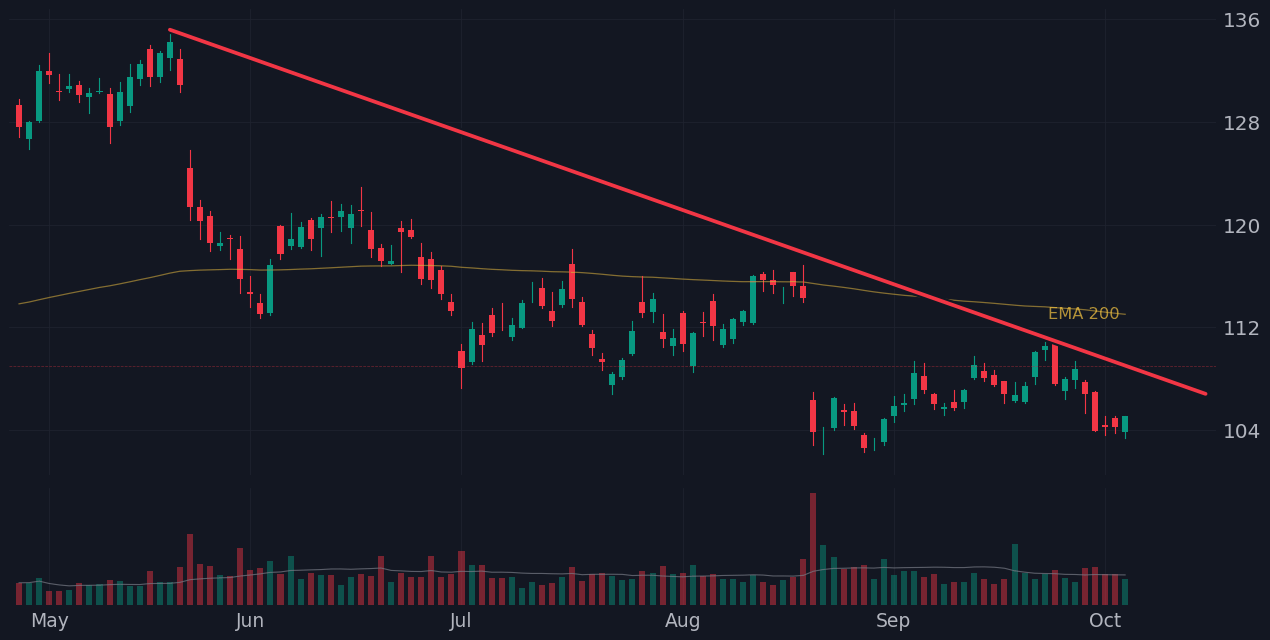
Daily chart. Broke out Oct 8, 2026 at $110.56 and confirmed Oct 9, 2026. Closed at $121.25 on Oct 29, 2026.
Swipe for more.
The watching is done for you. You make the call.
Every day KwickScan checks about 4,500 NYSE & Nasdaq stocks and puts the ones about to break out on your list.
The scan runs on daily charts every day, and on weekly charts at the end of each week for the slower, bigger moves you can hold for months. One click switches between them.
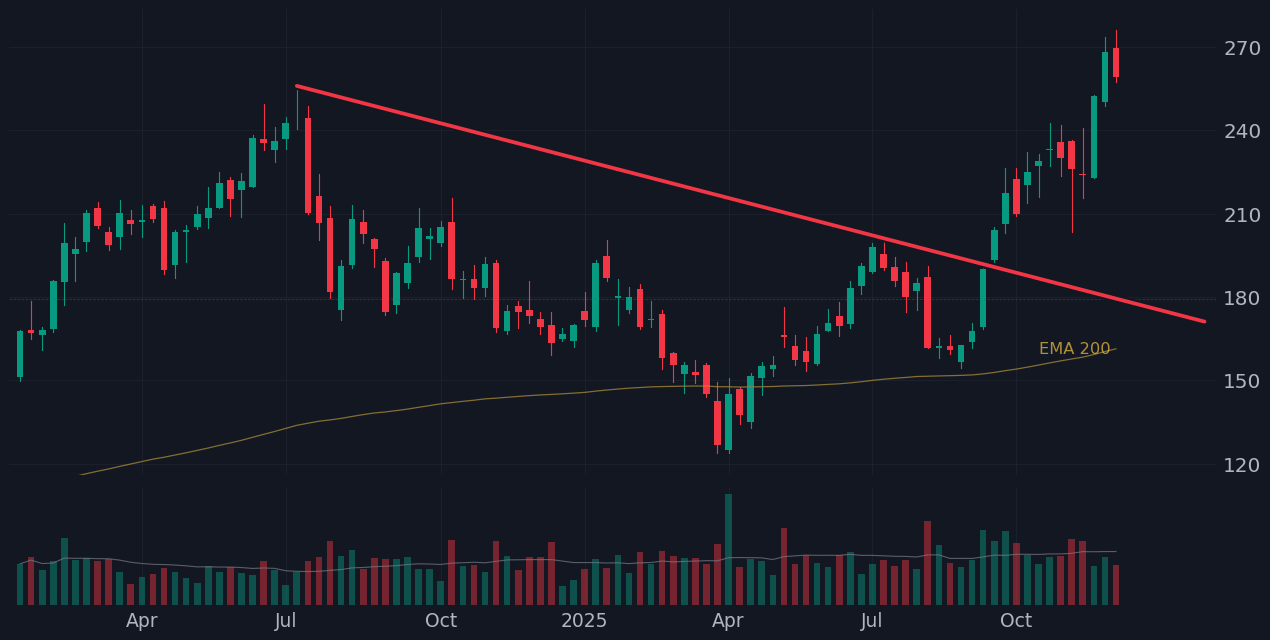
Star the stocks you care about. Your list sits beside the scanner and shows where each one is, so you see the moment one of yours sets up, breaks out or has earnings coming.
Type any ticker for its short-term trend, its long-term average and where it sits against its resistance line, with the chart beside it. Useful before you buy, or for a stock that isn't on the list.
A report can move a stock sharply either way. The Earnings tab lays out the week by day, before the open or after the close, with your own setups and Focus list stocks marked first.
Four ways investors and swing traders put it to work.
See what's breaking out today and what's close, so you're ready before it moves.
Use the breakout line to pick strikes at prices the stock has respected before.
Buy when price pushes through the line; step aside when it gets turned back.
It fits your framework. It shows you the data; what you do with it is up to you.
What it takes to find breakouts by hand, and what KwickScan does for you.
The scanner keeps growing. These are being built and tested now, and come to members as they're ready.
Support zones where buyers stepped in twice, and selling zones where sellers pushed back.
The classic base-and-handle pattern, found and scored for you.
An email when one of your stocks breaks out or confirms.
I built KwickScan for my own investing and swing trading. The hard part was never the decision; it was the search: going through thousands of charts to find the few worth a look. KwickScan does that search and puts what matters right in front of you.
It has taken more than 500 hours so far, the rules are tested on five years of past prices, and I'm still working on it. I use it every day, look at its results every day, and make it a little better each time.
It's built for anyone. You don't need to know technical analysis; I keep it as simple as I can. If it helps others the way it helps me, that's why I'm sharing it.
Harsh, founder of KwickScan
One monthly price for everything.
Full access to the US market scanner. Billed monthly; cancel anytime.
Can't find your answer? Email support.
No. KwickScan is an educational tool that finds chart patterns with fixed rules. It doesn't know your situation and doesn't tell you what to buy or sell. See the Disclaimer.
KwickScan is invite-only while seats are limited. Join the waitlist: invites go out from it as seats open, and an invite lets you subscribe straight away.
From your account page, any time. You keep access until the end of the period you've paid for, and you won't be charged again.
Setups update once a day after the market closes. It isn't a real-time feed.
US stocks (NYSE and Nasdaq) only. Each market is a separate product with its own plan.
Yes. Every card says in one sentence what's happening and which price matters. The guide explains the rest in plain English.